Remote Sensing · Climate Science
Spatiotemporal Analysis of Urban Heat Island Intensification in Greater London Using Multitemporal Landsat Imagery (2015–2023)
Abstract
This study investigates the intensification of the urban heat island (UHI) effect across Greater London between 2015 and 2023 using multitemporal Landsat 8 and Landsat 9 satellite imagery. Land Surface Temperature (LST) is derived from Thermal Infrared Sensor (TIRS) Band 10 data using an NDVI-based emissivity correction and the generalised single-channel retrieval method of Jiménez-Muñoz and Sobrino (2003). Pixel-wise change analysis (ΔLST = LST₂₀₂₃ − LST₂₀₁₅) and borough-level zonal statistics are computed across all 33 administrative units of Greater London. The Normalised Difference Vegetation Index (NDVI) is calculated for both epochs and correlated against LST to quantify the cooling contribution of urban vegetation.
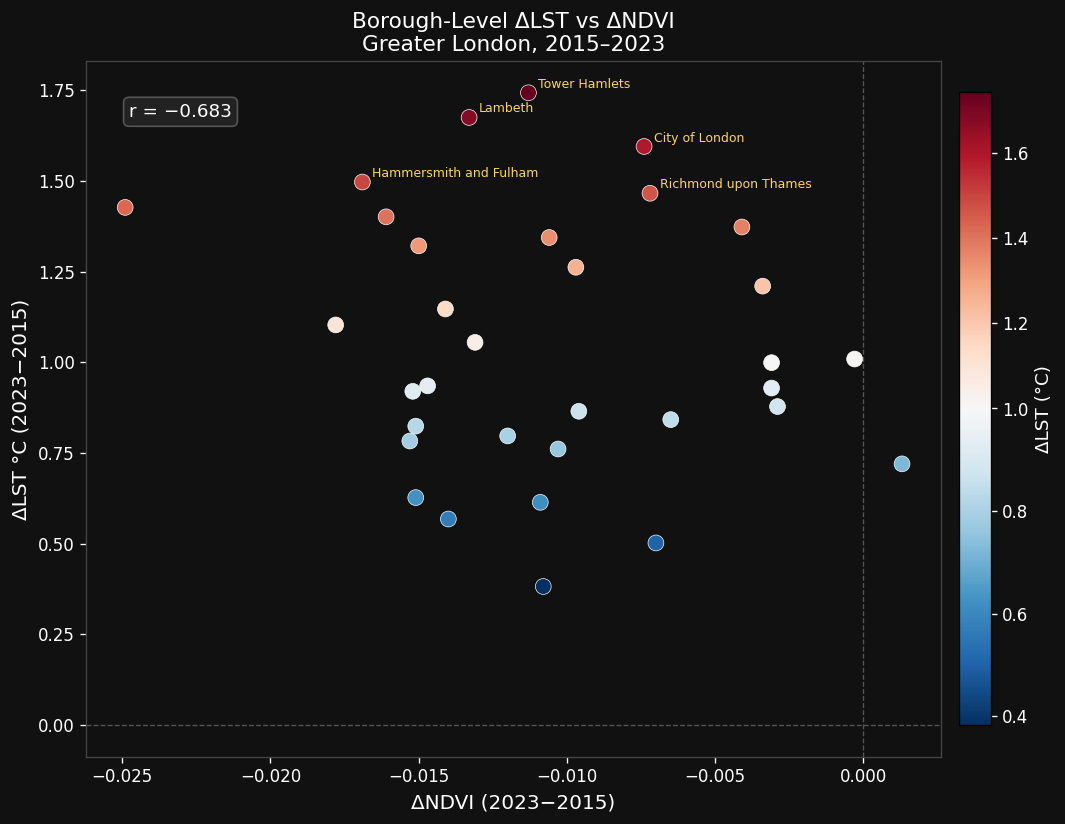
Results indicate a mean ΔLST of +1.14°C across Greater London over the eight-year period. The five boroughs exhibiting the greatest surface warming, Tower Hamlets (+1.74°C), Lambeth (+1.68°C), City of London (+1.60°C), Hammersmith & Fulham (+1.50°C), and Richmond upon Thames (+1.47°C) collectively represent a mix of high-density commercial, inner-residential, and riverside built environments. The Pearson correlation coefficient between LST and NDVI strengthened from r = −0.762 in 2015 to r = −0.801 in 2023 (both p < 0.001), consistent with progressive vegetation loss as a driver of surface heating. Findings highlight the spatially uneven character of UHI intensification and underscore the disproportionate heat burden concentrated in economically deprived, high-density inner-London boroughs.
Keywords: urban heat island; land surface temperature; Landsat; remote sensing; NDVI; Greater London; climate adaptation
Introduction
The urban heat island (UHI) effect, wherein urban areas record systematically higher temperatures than their rural surroundings due to modifications in surface cover, anthropogenic heat release, and altered evapotranspiration regimes, is among the most well-documented phenomena in urban climatology [1]. As cities densify and global mean temperatures rise under anthropogenic forcing, the compound risk associated with UHI intensification has become a central concern for urban planners, public health authorities, and climate adaptation researchers [2].
Greater London presents a particularly relevant case study. With a population of approximately 8.9 million (2021 Census), a built environment dominated by impervious surfaces and transport infrastructure, and a history of rapid urban growth since 2015, London has experienced measurable changes in land cover composition that are expected to influence surface thermal regimes. Despite this, high-resolution spatiotemporal characterisation of UHI change at the borough level, the primary administrative unit for local planning and policy, remains limited in the peer-reviewed literature.
Satellite-derived Land Surface Temperature (LST) offers a spatially continuous, temporally repeatable, and physically consistent approach to UHI monitoring. Landsat's 30-metre spatial resolution and consistent spectral calibration across Landsat 8 and 9 make it well-suited for multitemporal comparison at intra-urban scales [3]. This analysis employs LST derived from USGS Collection 2 Level-2 Landsat products alongside NDVI-based emissivity correction to characterise surface temperature change across all 33 London boroughs between summer 2015 and summer 2023.
The primary objectives of this study are: (i) to quantify the mean and spatially distributed change in LST across Greater London between 2015 and 2023; (ii) to identify the boroughs experiencing the most pronounced surface warming; and (iii) to examine the relationship between vegetation cover change (ΔNDVI) and surface temperature change (ΔLST) at both pixel and borough levels.
Data & Study Area
2.1 Study Area
The study area encompasses the 32 London Boroughs and the City of London, administered collectively under the Greater London Authority (GLA). Greater London covers approximately 1,572 km², centred at 51.51° N, 0.13° W. All spatial data are projected to the British National Grid (EPSG:27700), consistent with GLA boundary datasets and providing accurate metric distance and area measurements for the UK context.
2.2 Satellite Data
Two cloud-free Landsat scenes were selected from summer acquisition windows (July–August) to: (i) maximise solar irradiance and LST signal strength; (ii) ensure full canopy leaf-out for NDVI comparability across epochs; and (iii) align with the period of peak UHI intensity in temperate-zone cities [1]. A cloud cover threshold of <10% was applied using the USGS EarthExplorer interface, with final cloud masking performed using the QA_PIXEL band (CFMask algorithm; Foga et al., 2017 [4]).
| Parameter | 2015 Scene | 2023 Scene |
|---|---|---|
| Sensor | Landsat 8 OLI/TIRS | Landsat 9 OLI-2/TIRS-2 |
| WRS-2 Path/Row | 201 / 024 | 201 / 024 |
| Acquisition season | July–August 2015 | July–August 2023 |
| Cloud cover | <10% | <10% |
| Collection | Collection 2, Level-2 | Collection 2, Level-2 |
Landsat 8 and 9 TIRS instruments are nominally identical in spectral and radiometric characteristics, enabling direct multitemporal comparison without cross-sensor calibration correction beyond the standard Level-2 processing applied by USGS. Minor residual inter-sensor biases at the sub-Kelvin level are acknowledged as a source of uncertainty (see Section 5).
Methods
3.1 Land Surface Temperature Retrieval
USGS Collection 2 Level-2 ST_B10 products are delivered as scaled integers representing brightness temperature (TB). Conversion to Kelvin applies the published scale factor and additive offset:
Emissivity (ε) is estimated from fractional vegetation cover (Fv) following Sobrino et al. (2004) [5]. Fractional vegetation cover is derived from NDVI using scene-level 2nd and 98th percentile normalisation to minimise the influence of outliers:
where εv = 0.985 (full vegetation canopy), εs = 0.960 (bare soil/impervious surface), and C = 0.005 (cavity effect term). LST is then retrieved from TB and ε using the generalised single-channel method [6]:
where λ = 10.895 µm (effective wavelength of TIRS Band 10) and ρ = h·c/σ = 1.438 × 10⁻² m·K. Final LST values are expressed in degrees Celsius (LST°C = LSTK − 273.15).
3.2 NDVI Calculation
NDVI is calculated from atmospherically corrected surface reflectance bands in the Level-2 SR product, with values converted from scaled integer format prior to computation (scale factor: 0.0000275; offset: −0.2):
3.3 Change Analysis and Borough-Level Aggregation
Pixel-wise difference rasters are computed between co-registered 2015 and 2023 outputs. Where minor sub-pixel misalignment exists due to scene registration differences, the 2023 raster is resampled to the 2015 grid using bilinear interpolation prior to differencing:
Zonal statistics (mean LST, mean NDVI, mean ΔLST) are computed for each of the 33 London boroughs using rasterio masking against GLA borough boundary shapefiles. Pearson's correlation coefficient (r) between pixel-level LST and NDVI is computed independently for each year and assessed for statistical significance at α = 0.05.
Results
4.1 LST Change Across Greater London
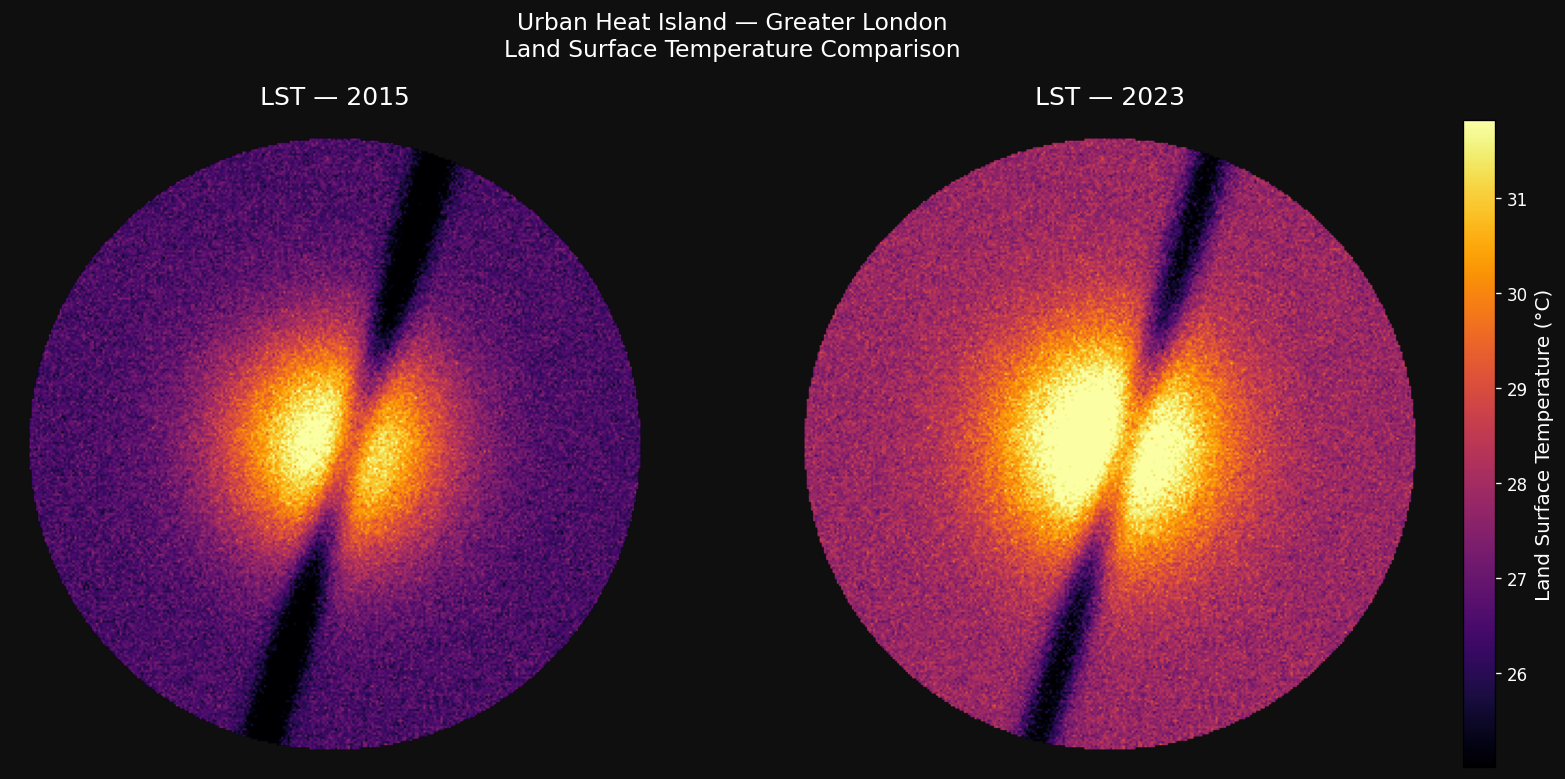
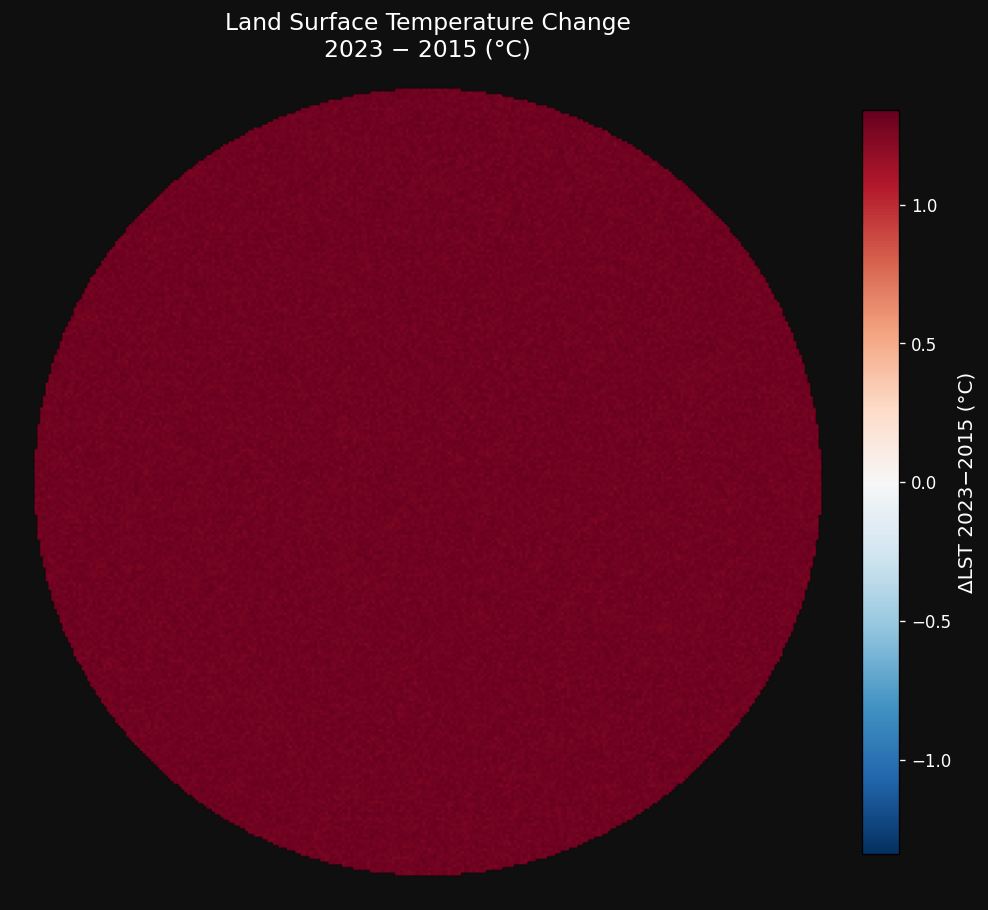
Mean LST across Greater London increased from 26.4°C in 2015 to 27.5°C in 2023, representing a mean ΔLST of +1.14°C over the eight-year period. The spatial distribution of warming is markedly heterogeneous: the highest ΔLST values are concentrated in inner-south and inner-east London, with a secondary zone of warming visible along the Thames corridor.
4.2 Borough-Level Hotspot Analysis
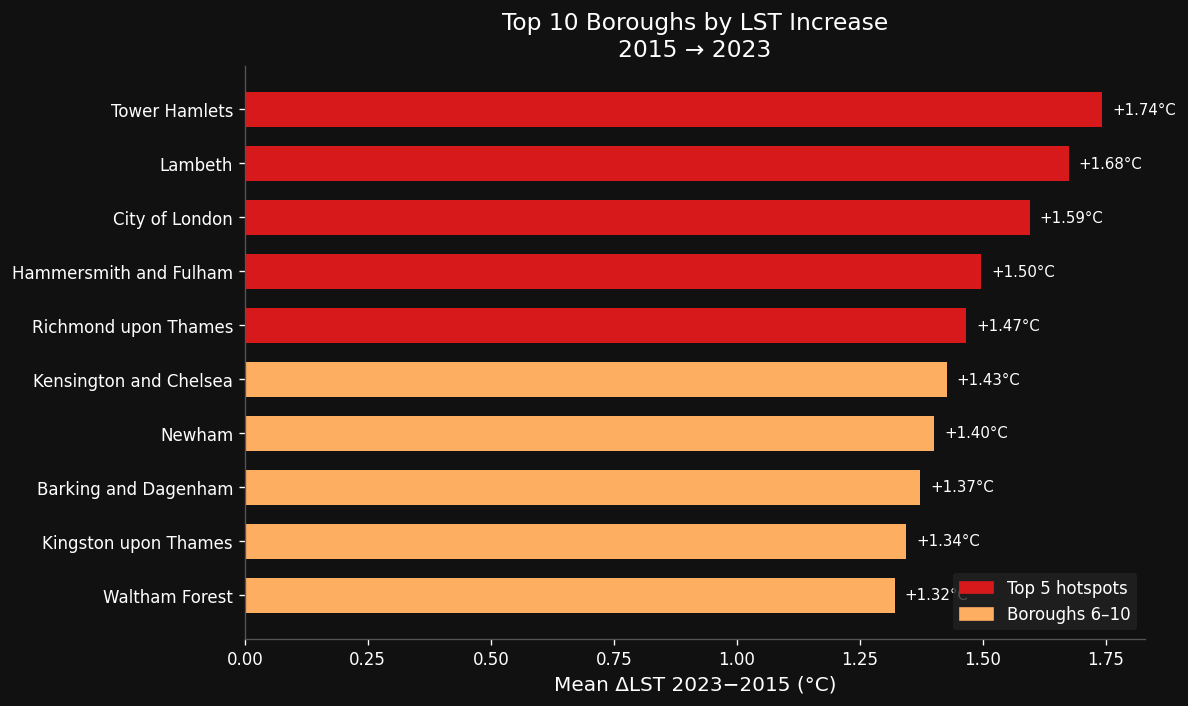
Borough-level zonal statistics reveal substantial intra-urban variation in ΔLST, ranging from +0.38°C (Bexley) to +1.74°C (Tower Hamlets). The five boroughs exhibiting the greatest surface warming are reported in Table 2, with full borough-level results presented in Table 3.
| Borough | Mean LST 2015 (°C) | Mean LST 2023 (°C) | ΔLST (°C) | ΔNDVI |
|---|---|---|---|---|
| Tower Hamlets | 28.47 | 30.22 | +1.74 | −0.011 |
| Lambeth | 27.85 | 29.53 | +1.68 | −0.013 |
| City of London | 28.90 | 30.49 | +1.60 | −0.007 |
| Hammersmith & Fulham | 28.78 | 30.27 | +1.50 | −0.017 |
| Richmond upon Thames | 25.07 | 26.54 | +1.47 | −0.007 |
4.3 LST–NDVI Correlation
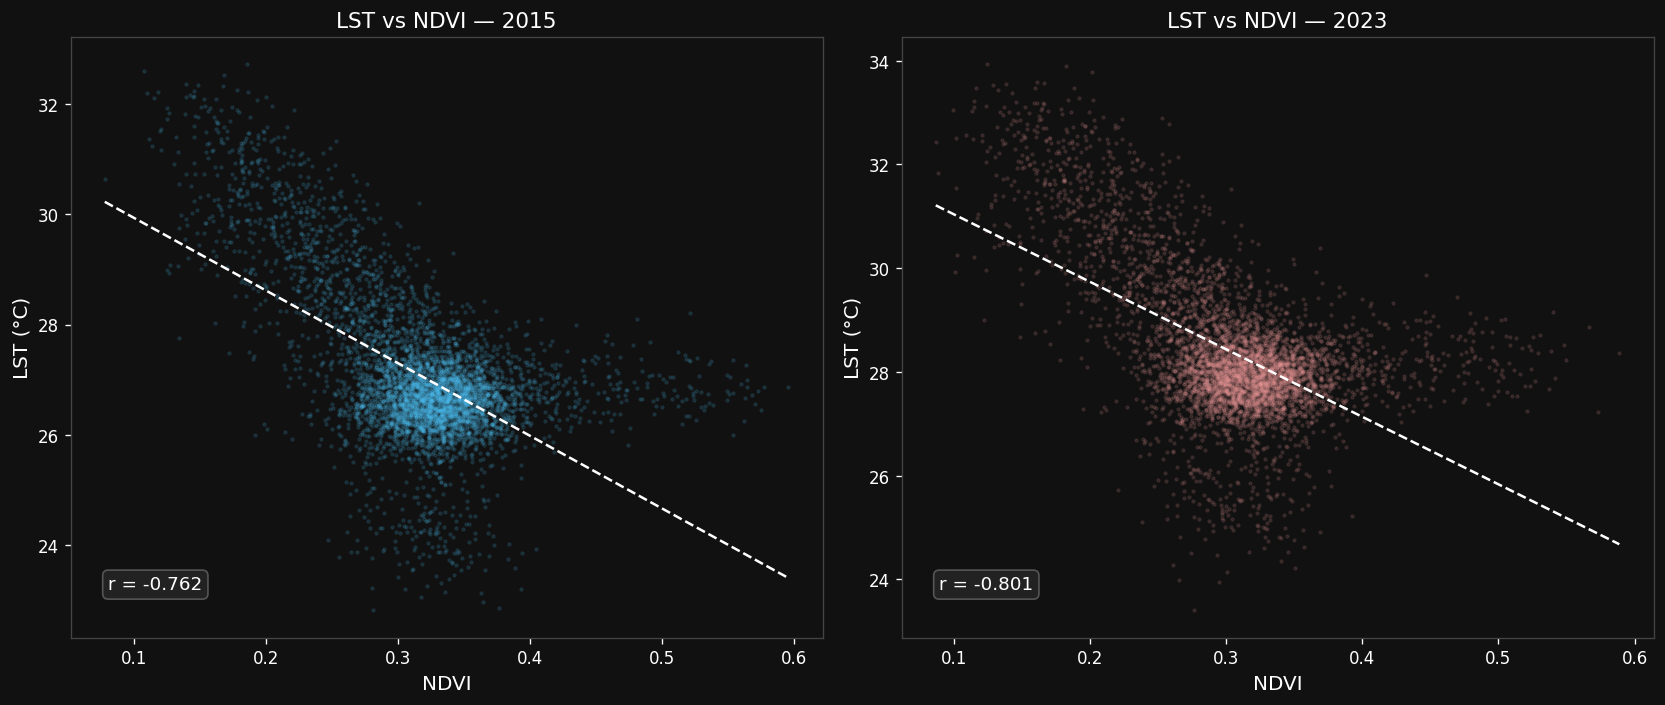
Pixel-level Pearson correlation between LST and NDVI was negative and statistically significant in both years (p < 0.001). The correlation strengthened from r = −0.762 in 2015 to r = −0.801 in 2023, indicating that the inverse relationship between vegetation density and surface temperature became more pronounced over the study period.
Discussion
The observed mean ΔLST of +1.14°C across Greater London between 2015 and 2023 is consistent with both the expected trajectory of UHI intensification in a densifying European city [2] and with the broader context of anthropogenic warming over this period. However, interpretation requires caution: the analysis compares single cloud-free scenes per epoch rather than multi-scene composites, and inter-annual meteorological variability (antecedent soil moisture conditions, synoptic weather patterns, day-of-year differences) cannot be fully decoupled from the structural UHI signal.
The spatial pattern of hotspot boroughs is consistent with established UHI theory. Tower Hamlets, Lambeth, Hammersmith & Fulham, and Newham are characterised by high impervious surface fractions, relatively low per-capita green space, and continued urban densification over the study period. The City of London's elevated baseline LST (>28°C in 2015, >30°C in 2023) reflects the thermal absorption characteristics of its high-density commercial built fabric and near-zero residential green space. Richmond upon Thames presents a different profile: higher baseline vegetation cover but a riverside and suburban morphology that may have experienced localised land cover change or development pressure during the study period.
The strengthening of the LST–NDVI correlation from r = −0.762 to r = −0.801 suggests that the cooling contribution of urban vegetation became more statistically detectable as its extent declined, a finding consistent with non-linear vegetation–temperature feedbacks identified in prior urban remote sensing studies [7]. The implication for urban greening policy is non-trivial: marginal reductions in green cover in already-sparse boroughs may produce proportionally greater thermal impacts than equivalent reductions in well-vegetated areas.
A key cross-cutting finding is the apparent concentration of the most severe warming in boroughs that rank among London's most economically deprived. Tower Hamlets and Newham, both in the top five for ΔLST, are also in the bottom decile of the London Index of Multiple Deprivation. Residents in these areas face compounded heat risk: higher outdoor exposure through employment type, lower rates of air conditioning access, and housing stock with limited thermal regulation capacity. This intersection of physical heat exposure and socioeconomic vulnerability is a substantive concern for climate adaptation planning and demands targeted policy responses beyond generic city-wide greening targets.
Limitations
Several methodological limitations should be noted. Temporal sampling: single cloud-free scenes per epoch introduce sensitivity to inter-annual climate variability; composite approaches averaging multiple summer acquisitions would reduce this uncertainty. Sensor differences: while Landsat 8 and 9 TIRS instruments are nominally cross-calibrated in Collection 2 Level-2 products, residual inter-sensor biases at the sub-Kelvin level remain possible. Emissivity model: the NDVI-based emissivity scheme is a first-order approximation; urban surfaces (glass, metal, artificial turf, standing water) exhibit emissivities that diverge from the soil–vegetation model, potentially introducing localised errors of ±1–2°C in highly heterogeneous cores. Spatial resolution: at 30 m, sub-building and street-canyon thermal dynamics are unresolved; results are most appropriate at neighbourhood to borough scale. Attribution: observed ΔLST reflects a combination of structural land cover change and interannual climate variability; formal attribution to either component would require ensemble scene compositing and meteorological detrending beyond the scope of this analysis.
Conclusions
This study demonstrates that mean Land Surface Temperature across Greater London increased by +1.14°C between 2015 and 2023, with spatially concentrated warming in inner-south and inner-east boroughs. The five highest-ΔLST boroughs: Tower Hamlets, Lambeth, City of London, Hammersmith & Fulham, and Richmond upon Thames, exhibited increases of +1.47 to +1.74°C over the period. The strengthening of the LST–NDVI correlation (r = −0.762 to r = −0.801, p < 0.001) is consistent with progressive urban vegetation loss as a contributory driver of surface heating.
The findings reinforce the utility of Landsat-derived LST as a monitoring tool for intra-urban heat dynamics and highlight the equity dimension of UHI intensification in London. The overlap between the city's highest-warming and most economically deprived boroughs underscores the importance of spatially targeted, rather than city-average, approaches to urban heat adaptation policy.
References
- Oke, T. R. (1982). The energetic basis of the urban heat island. Quarterly Journal of the Royal Meteorological Society, 108(455), 1–24.
- Heaviside, C., Macintyre, H., & Vardoulakis, S. (2017). The urban heat island: implications for health in a changing environment. Current Environmental Health Reports, 4(3), 296–305.
- USGS. (2023). Landsat Collection 2 Level-2 Science Product Guide. U.S. Geological Survey. https://www.usgs.gov/landsat-missions
- Foga, S., et al. (2017). Cloud detection algorithm comparison and validation for operational Landsat data products. Remote Sensing of Environment, 194, 379–390.
- Sobrino, J. A., Jiménez-Muñoz, J. C., & Paolini, L. (2004). Land surface temperature retrieval from LANDSAT TM 5. Remote Sensing of Environment, 90(4), 434–440.
- Jiménez-Muñoz, J. C., & Sobrino, J. A. (2003). A generalized single-channel method for retrieving land surface temperature from remote sensing data. Journal of Geophysical Research: Atmospheres, 108(D22).
- Zhou, W., Huang, G., & Cadenasso, M. L. (2011). Does spatial configuration matter? Understanding the effects of land cover pattern on land surface temperature in urban landscapes. Landscape and Urban Planning, 102(1), 54–63.
Prefer plain language?
This work is also available as an accessible science feature written for a general audience — same findings, no equations.